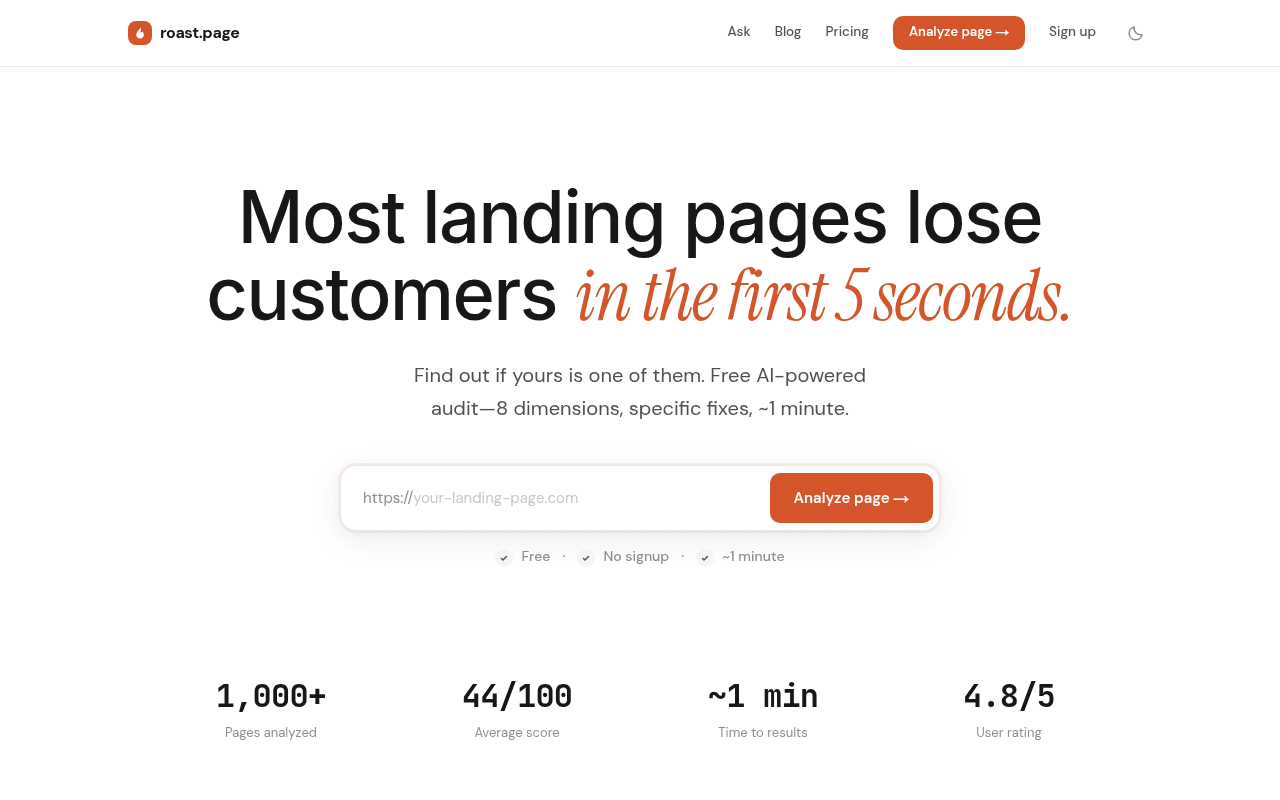
https://roast.page
https://roast.page
Screenshot of roast.page
80of 100
B+

roast.page practices what it preaches — clean hero, frictionless CTA, and the '44/100 average score' stat is a brilliant anxiety trigger. The page loses steam mid-scroll: the comparison table is compelling but the 'Real improvements' section uses suspiciously round numbers that undermine credibility, and 1,000+ pages analyzed is too thin a social proof anchor for a tool asking you to trust its AI judgment.

Your action plan

Ordered by conversion impact. Click any fix to see the before → after.

1
Replace round-number case study stats with specific, verifiable outcomes
High ImpactSome WorkReal improvements section — SaaS: +44, E-commerce: +31, Agency: +37
Currently
Representative examples of the kind of improvements our analysis drives
Recommended
Add company type, timeframe, and one specific change made: e.g. 'B2B SaaS tool, 3 weeks post-audit, hero rewrite drove +44pt score and 22% lift in trial signups'
Round numbers like +44, +31, +37 read as fabricated. Specificity is the single strongest credibility signal in social proof — vague 'representative examples' disclaimer actively signals the numbers are not real.

Copy rewrites

Ready to use

Drop-in replacements for your highest-leverage text. Each rewrite explains the conversion principle behind it.

Subheadline below hero H1
Find out if yours is one of them. Free AI-powered audit—8 dimensions, specific fixes, ~1 minute.
Get a scored audit across 8 conversion dimensions — with specific, prioritized fixes you can ship today. Free, no signup.
Specificity and outcome-focus: 'prioritized fixes you can ship today' is more actionable than 'specific fixes' and reinforces immediacy without changing length.
Real improvements section disclaimer
Representative examples of the kind of improvements our analysis drives.
Real audits. Real pages. Here is what changed after acting on the recommendations.
Removes the legal-sounding hedge that signals the numbers are not real. Direct attribution increases credibility via specificity principle.
Section headline mid-page
Why not just hire an agency?
Why agencies charge $5,000 for what takes us 1 minute
Anchoring and contrast: leading with the price differential primes the visitor to see the comparison table as a value proof, not a defensive argument.
Micro-copy below CTA button
Free · No signup · ~1 minute
Free forever · No signup · Results in 60 seconds
Urgency and commitment reduction: 'Free forever' removes fear of future paywalls; '60 seconds' is more visceral than '~1 minute' and matches the LCP speed the tool actually delivers.
💡

The killer move

High Impact
Add a live score ticker to the hero

Show a real-time feed of anonymized recent analyses — domain type, score, and top issue — directly below the input field. This creates social proof, demonstrates the product working, and makes the 44/100 average score feel earned rather than invented. Hotjar's live visitor counter increased signups 17% in a documented test.

How visitors experience your page

Second-by-second walkthrough.

4 strong1 mixed
0-3 secondsStrong
0-3s first impression: Large bold headline with italic orange accent, URL input with orange CTA button, three micro-trust badges below input
Headline creates immediate anxiety-based relevance for anyone with a landing page. The orange CTA is impossible to miss. Visitor likely thinks: this is for me, and it is free — low resistance to trying it.
3-8 secondsStrong
3-8s value scan: Four stat blocks: 1,000+ pages, 44/100 average score, 1 min, 4.8/5 rating
44/100 average score is a genius anxiety amplifier — visitor immediately wonders if their page scores that low. 4.8/5 rating adds credibility. 1,000+ is the weakest stat but acceptable at this stage.
8-15 secondsStrong
8-15s proof seeking: Sample report mockup with scores and a priority fix recommendation, How it works 4-step process
The sample report is the right element here — it shows exactly what you get before you commit. The 4-step process removes procedural uncertainty. Visitor is likely moving toward the CTA.
15-30 secondsMixed
15-30s objection handling: 8 dimensions with weights, Real improvements case studies, agency comparison table
Dimension weights are smart and build confidence. But the case study numbers feel fabricated and the 'representative examples' disclaimer actively undermines them. Comparison table is compelling but headline is defensive.
30+ secondsStrong
30s+ decision: FAQ accordion, Resources section, bottom CTA repeat with URL input
FAQ answers are unusually specific and honest — they directly address skepticism about AI generic advice. Bottom CTA repeat is well-placed. Visitor who reached here is highly likely to convert.

Health check

8 dimensions, weighted by conversion impact.

First impression & hero
20%
8/10
Anxiety-triggering headline, frictionless input, and three micro-trust badges make this a textbook PLG hero — loses one point for no sample report escape hatch.
Copy & messaging
20%
8/10
Tight, benefit-led copy throughout with strong specificity — the 'representative examples' disclaimer and round case study numbers are the only meaningful credibility leaks.
Call-to-action
15%
8/10
Orange button is visually dominant, verb-led, and repeated at bottom — missing a low-commitment secondary CTA for visitors not ready to submit their URL.
Trust & social proof
15%
6/10
4.8/5 rating and 44/100 average score are strong trust anchors, but 1,000+ pages is thin, there are no named testimonials, and the case study numbers read as illustrative rather than real.
Visual design & layout
10%
8/10
Clean, high-contrast, well-spaced — the orange accent system is consistent and the sample report mockup is the most effective visual on the page.
Page structure & flow
8%
8/10
Hero to proof to mechanism to comparison to FAQ to CTA is a textbook persuasion arc executed with discipline — no wasted sections.
Technical & SEO signals
7%
10/10
PageSpeed 99, FCP 0.3s, LCP 0.8s, SEO 100 — this is genuinely exceptional and directly validates the product's own credibility as a page analysis tool.
Differentiation & positioning
5%
7/10
The agency comparison table is the strongest differentiator on the page, but the headline undersells it — the AI plus data objectivity angle is not prominent enough in the hero.

Page speed

Tested via Google Lighthouse
99/100
Overall score
Combined performance rating
0.8 s
Largest paint
Time until the main content is visible
0.002
Layout shift
How much the page moves while loading
0.3 s
First paint
Time until something first appears
1.4 s
Interactive
Time until the page is fully usable
Accessibility: 96SEO: 100Best Practices: 100

Want mobile analysis and fresh re-runs?

Buy roasts to unlock mobile analysis, re-analyze on demand, and more for roast.page.

See roast packs →